|
This
information is very old...most machines where this stuff were
installed are gone...still, it is a lot of information, so I'd hate
to just delete it when it might be useful to someone, somewhere.
Dianne Patterson 10/25/2006
This page describes Event Related Analysis with the New MGH program
which only runs on Linux (and is still problemamatic. Perhaps you
really want the Afni_Event page which
describes a processing stream we have used successfully for years
involving afni and mgh)
You
can do analysis of individuals without talairaching their data,
but then you cannot do group analyses (Fixed or Random Effects).
You can talairach the data and do group analysis. With a little
extra work, you can do both. The first several steps in the analysis
are the same irrespective of your talairaching decision.
|
|
|
No
Talairaching
|
Talairaching
|
|
|
|
Creating
the Parameter File
- For
the Tutorial Data, par.txt files have been provided.
- Purpose:
The paradigm file is analagous to parts of the waver 1D file for
afni and the model specification in SPM. It describes the timing
of control and stimulus conditions throughout the functional run.
You will create one paradigm file for each run and place a copy
of the paradigm file into the directory with that run's .bshort
files. The paradigm file is a text file containing two columns
of numbers. The first column contains the stimulus onset time,
in seconds, relative to the time at which the first stored image
of the run was collected. The second column represents the condition
code for each stimulus. By convention, the code 0 represents the
baseline or fixation condition. The other conditions are to be
numbered sequentially starting with 1. Give the file a name that
describes your study, e.g. motorstudy.para. The .para extension
is not required, but helps to identify the file as a paradigm
file.
For the event related paradigms, the time (column one) should
be the time of stimulus onset and need not be an integer multiple
of the TR. For example, in the paradigm file below, the first
stimulus (condition 1) was presented 2 seconds before the first
image was acquired, the second stimulus (condition 3) at the first
image, and the third stimulus (fixation) at 4.5 seconds into the
imaging run.
-2.0 1
0.0 3
4.5 0
For block design paradigms there will be a line for each image.
The first column is the TR onset. The second column is the condition
code for the current block. For example, if you have 2 12 second
blocks and a TR of 3 seconds (starting with the baseline condition),
the paradigm file will look like this:
0 0
3 0
6 0
9 0
12 1
15 1
18 1
21 1
Such
files can be created in Excel or Gnumeric (the latter is a spreadsheet
program on Charlie, the Linux machine). You should have a parameter
file for each run with your tutorial data because the tutorial
data is event-related, which means that the timing will be unique
for every run.
Make
Analysis
- Purpose:
With this program (mkanalysis-sess.new) you define how the raw
or pre-processed data for each session will be averaged together.
Data are not actually averaged at this stage. You may wish to
analyze your study in more than one way. For example with and
without motion correction, or you may wish to define your events
based on subject response in one analysis and on stimulus type
in another. Give each analysis a name ("analysisname")
that will be used in subsequent processing steps. For multiple
analyses, you will run mkanalysis-sess once for each analysis,
giving each a different analysis name.
This program creates a subdirectory called "analysisname"
in the study directory and writes two files there: analysis.cfg
(see further MGH documentation) and analysis.info. It also checks
that all subject data is accessible and creates default scripts
for the analysis.
- Usage:
mkanalysis-sess.new
Required
Arguments
-analysis analysisname : name of session-level functional analysis
-TR TR : TR value in seconds
-paradigm parname : name of paradigm file
-designtype type : type of design. Legal values are: event-related,
blocked, abblocked, retinotopy
Optional
Arguments
-fsd FSD : functional subdirectory
-funcstem stem : stem of functional data (default = f or fmc)
-motioncor : use motion corrected data (see mc-sess)
-runlistfile filename : file with list of runs to include in analysis
-inorm : intensity normalize data (see inorm-sess)
-fwhm FWHM : Full-Width/Half-Max for in-plane smoothing (mm)
-nskip N : skip the first N time points in each run
-tpef filename : time-point exclude file name
-notrendfit : do not fit a linear trend
Event-Related
and Blocked Arguments
-nconditions Nc : number of conditions (excluding fixation)
-timewindow TW : event time window (sec)
-prestim PS : event prestimulus window (sec)
-TER TER : temporal estimation resolution (sec) (This makes a
jagged HDR...perhaps it is best avoided)
-gammafit gfDelta gfTau : assume IRF is a gamma function
-taumax TauMax : maximum lag for noise autocor and whitening (sec)
-timeoffset toffset : time offset (sec) to add to each paradigm
file
Retinotopy
and AB Blocked Arguments (Required)
-ncycles N : number of cycles in each run
Other
Optional Arguments
-umask umask : set unix file permission mask
-version : print version and exit
-help : print help info
- Command
Examples
(run from your parent subject directory):
>mkanalysis-sess.new
-analysis video1 -TR 2.5 -paradigm par.txt -designtype event-related
-funcstem fss -inorm -nskip 4 -nconditions 3 -timewindow 22.5
-prestim 5
>mkanalysis-sess.new -analysis video2 -TR 2.5 -paradigm par.txt
-designtype event-related -funcstem fmc -inorm -fwhm 5 -nskip
4 -nconditions 3 -timewindow 22.5 -prestim 5
- Explanation:
- -analysis
Here we create two new directories, video1 and
video2 respectively, in the
parent subject directory (e.g., /buddy/data/tutorial). For
video1 we use the smoothed data, and for video2 we use the
unsmoothed data.
- -TR
2.5 sets
the TR value in seconds.
- -paradigm
par.txt identifies
the parameter file to use in making the analysis
- -designtype
event-related identifies
the design type using one of the 4 legal values (i.e., "event-related").
- -funcstem
identifies
the input volume functional stem (fss or f).
- -inorm
tells the program to use intensity normalized data.
- -fwhm
5 has been added to the analysis of the unsmoothed data
in video2 to add smoothing. Smoothing increases the signal to
noise ratio...but if spatial-smoothing
overdoes it...then mkanalysis is a better step to try it on.
Spatial smoothing smooths within AND between planes but mkanalysis
smooths only within plane.
- -nskip
4 indicates
that the first 4 timepoints should be disregarded (the first
few scans are often not very good)
- -nconditions
3 identifies
the number of conditions (3), excluding fixation (i.e., the
control)
- -timewindow
22.5 This
tells the program to display the graph of the HDR intensity
line with an x-axis of 22.5 seconds.
- -prestim
5 This
tells the program to display the graph of the HDR intensity
line beginning 5 seconds before the stimulus onset. The program
will know the timing of the stimulus onset from the par file.
- The
prestim intensity values will eventually be used as baseline
average values for further calculations. These intensity values
will be subtracted from each intensity line so that all the
lines can begin at the same level. tkmedit allows you to subtract
prestim average (you'll see this graphed)
Issue to learn about: BUT we don't yet
know whether this subtracts the values from the text file output
at some later step.
- Output:
- The
mkanalysis-sess.new command runs very quickly (~1 sec)
- It
generates a directory with the analysis name containing two
small text files, analysis.info and analysis.cfg that contain
information about the analysis.
Select
Average
- Purpose:
This program computes the average signal intensity maps for each
condition for each individual subject. The output is stored in
a subdirectory called "analysisname" under the bold
subdirectory in the subject's directory. (The "analysisname"
was defined in the mkanalysis-sess step,
above). This average data can be further processed on an individual
basis and/or can be used in group analysis.
- Usage:
selxavg-sess
Required
Arguments:
-analysis analysisname : name of functional analysis
Session
Arguments (Required)
-sf sessidfile ...
-df srchdirfile ...
-s sessid ...
-d srchdir ...
Session
Arguments (Optional)
-umask umask : set unix file permission mask
-version : print version and exit
- Command
Examples:
>selxavg-sess
-analysis video1 -sf sessidfile -d .
>selxavg-sess -analysis video2 -sf sessidfile -d .
- Explanation:
- -analysis
identifies an analysisname for each directory where output
will be stored: video1 and video2.
- -sf
sessidfile identifies the sessidfile used to find the
subjects' directories.
- -d
/buddy/data/tutorial identifies the parent subject directory
to work in.
- Output:
- Together,
these two selxavg-sess commands took under 15 minutes to run.
The video1 (fss) analysis took under 1 minute. The video2 (fmc)
analysis took~13 minutes.
- In
each analyisdir (e.g., video1 and video2) selxavg creates the
following files: allvres.mat, h.dat, omnibus.mat, and studydir.
- selxavg-sess
also creates an analysis directory in the subject's bold directory
(e.g., for the tutorial, video1 and video2 directories are created
in each bold directory). These secondary analysis directories
contain the analysis.cfg and analysis.info files (same as the
copies in the main analysis dir), a full set (e.g., 25 pairs
for our tutorial data) of h_ bfloat and hdr files, a full set
of h-offset bfloat and hdr files, an h.bhdr and h.dat file (the
h.dat file is the same as the one in the main analysis dir),
h-offset.bhdr, h-sxa.log, X.mat and an omnibus directory.
- The
omnibus directory contains a full set of f_ bfloat and hdr files,
a full set of fsig_ bfloat and hdr files, f.bhdr and fsig.bhdr.
- selxavg
creates a log file each time it run (e.g., selxavg-sess-bold-video1-0205111510.log,
selxavg-sess-bold-video2-0205111512.log)
Make
Contrast
- Purpose:
This program creates a file specifying which contrasts will be
compared. The contrasts are not actually computed at this step.
You will supply a name for this contrast file (e.g., "allvcon"
below) which will be required at subsequent processing stages.
This is analogous to the definition of contrasts in spm. For multiple
contrasts, run mkcontrast-sess multiple times, defining a different
contrast file name each time. The contrast is defined with respect
to a particular analysis using the program options.
- Usage:
mkcontrast-sess
Options:
-contrast contrastname : contrast name
-analysis analysisname : name of session-level functional analysis
-a a1 <-a a2> ... : positive contrast conditions
-c c1 <-c c2> ... : negative contrast conditions
-setwdelay : prompt for setting of delay weights
-sumdelays : sum weighted delays
-rmprestim : subtract prestimulus baseline
-nosumconds : don't sum conditions (for f-test)
-ircorr nircorr : correlate with gamma function
-deltarange dmin dmax : range of delta for gamma function
-taurange tmin tmax : range of tau for gamma function
-umask umask : set unix file permission mask
-scriptonly : don't run, just generate a script
-version : print version and exit
- Command
Examples:
>mkcontrast-sess
-contrast allvcon -analysis video1 -a 1 -a 2 -a 3 -c 0 -ircorr
2 -deltarange 2 4
>mkcontrast-sess
-contrast allvcon -analysis video2 -a 1 -a 2 -a 3 -c 0 -ircorr
2 -deltarange 2 4
- Explanation:
Run mkcontrast-sess from your parent subject directory (e.g.,
/buddy/data/tutorial/).
- -contrast
allvcon creates a matlab *.mat file with the name
you provide (e.g., allvcon.mat). The
file holds contrast information, e.g., all conditions vs control
in this case.
- -analysis
identifies the analysis directory
where allvcon.mat will be stored.
- -a
1 -a 2 -a 3 -c 0 weights each of the three conditions
equally (1/3 each). and balances the summed conditions against
the control weight (1).
- -ircorr
tells mkcontrast-sess to correlate hemodynamic responses with
some number of ideal hemodynamic responses...in this case
2.
- -deltarange
flag specifies a 2 and 4 second offset from
0 for the two ideal hemodynamic responses. mkcontrast picks
the best HDR offset and displays only that one.
We don't know how to tell which one
it has picked.
- Output:
- mkcontrast-sess
runs very quickly (several seconds)
- It
creates a log file in the log directory: mkcontrast-sess.log
- It
creates a file (e.g. allvcon.mat) describing the contrasts in
the named analysis directory (the
analysis dir in the parent subject directory)
Statistics
Grinder
- Purpose:
This program is used to create statistical, significance, and
parametric maps for all of your subjects on an individual basis.
The map is computed from a given analysis and contrast. Significance
results are stored as log10 unless you specify
otherwise using -pxform option.
- Usage:
stxgrinder-sess
Options:
-analysis analysisname : name of session-level functional analysis
-append code : sets analysis to analysisname-code
-contrast contrastname : contrast name
-pxform xform : <log10>, ln, none
-space spacename : space in which to grind (native, tal, sph)
-hemi hemisphere : with sph space <lh rh>
-sf sessidfile ...
-df srchdirfile ...
-s sessid ...
-d srchdir ...
-scriptonly : don't run, just generate a script
-version : print version and exit
-umask umask : set unix file permission mask
- Command
Examples:
>stxgrinder-sess
-analysis video1 -contrast allvcon -sf sessidfile -d .
>stxgrinder-sess -analysis video2 -contrast allvcon -sf sessidfile
-d .
- Explanation:
stxgrinder-sess is run once for each of the two analyses. The
contrast to be used is specified (you could have several contrasts).
The program uses the sessidfile to find the subjects' directories.
See previous commands for explanations of each flag.
- Output:
- stxgrinder-sess
takes several minutes to run (~ 3 minutes for the tutorial
data).
- It
creates a log file in the log directory (e.g., stxgrinder-sess-bold-video1-allvcon.log)
- It
creates a directory (allvcon) full of files in the secondary
analysis directory (e.g., video1 in each subject's bold directory).
This contains several full sets of bfloat and hdr files: f_,
fsig_, iminsig_, minsig_, sig_, and t_. Each set has an accompanying
*.bhdr file. allvcon.mat (this is the same as allvcon.mat
in the main analysis directory) and sig_stxg.log are also
in this directory.
Register
Functionals to Structurals
- Purpose:
This step aligns the functional images to the 3D structural.
In this case, we have not talairached the data.
- Usage:
Tkmedit
Online Guide
- Command
Example
:
>tkmedit
e25996_anat orig -overlay /buddy/data/tutorial/e25996/bold/001/fmc
-overlay-reg /buddy/data/tutorial/e25996/bold/register.dat
-register
- Explanation:
This command brings up the tkmedit gui interface with your 3dvolume
in e26154_anat orig (the COR file location).
- -overlay
brings up the functional data from the specified directory.
Finally, the
- -overlay-reg
flag is followed by the path to the register.dat file (currently
the unity matrix) the
- -register
flag enables functional registration.
GUI
Interface
 Look Look
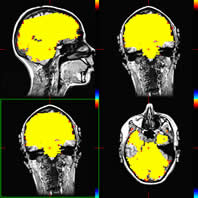 |
Choose
View-->Configure-->Functional overlay (set thresholds
to minimum=600, midpoint=700, slope=.001, although these #'s
can vary. The goal is to control the size and shape of the displayed
activation so that it looks like the picture to the left, even
if not yet aligned to the anatomical image). The images will
be rotated 90 degrees out of alignment with each other (this
is true at least for the tutorial data), you
must rotate and align them:
Tools-->fMRI-->register functional overlay. Click the
sagittal orientation button (on the main gui menu pictured above),
...rotate: 90 degrees (then click the right arrow on the rotate
menu). Next do finer grained alignment: translate (in mm...inplane
sliding) until they appear to be nicely aligned.
When you are satisfied with the registration, choose:
Save-->overlay registration. This alters the register.dat
file,and saves the original as register.dat.1
Here
you see the functional data overlayed on the 3D structural
and aligned.
|
- Make
sure register.dat file is no longer the unity
matrix to confirm that your changes have been made.
- This
does the registration for all runs for one subject. Repeat Functional-Structural
registration for each subject.
Check
your Work with tkmedit-sess
- Purpose:
To look at significance maps on non-talairached 3ds.
- Usage:
tkmedit-sess
Options:
-volid FSVolId : name of volume under subject/mri
-analysis analysisname : name of session-level functional analysis
-s sessid (only one allowed)
-isxavg method (fixed or random)
-contrast contrastname : contrast name
-map mapname : <sig>, minsig, iminsig, t
-mapanalysis analysisname : name of session-level functional analysis
-mapsess sessid from which to get the map
-mapisxavg method
-space spacename : <native> or tal
-d sessdir ...
-sessanat : use session 3d anatomical instead of recon
-fsd dir : functional subdirectory (bold)
-asd dir : anatomical subdirectory (3danat)
-scriptonly : don't run, just generate a script
-umask umask : set unix file permission mask
-version : print version and exit
- Command
Example
:
>tkmedit-sess -analysis video1 -contrast allvcon -map minsig
-s ./e26154 -d .
One can look at the "green squares" of the posclust
output by loading labels (e.g., /e26154_anat/label/posclust-0001.label;
this option is available in the gui interface). In addition, time
graphing options are available in the gui interface.
Further options to learn about: Look
into loading a label, then graphing current selection, then printing
timecourse summary--this can potentially give you averaged, baseline
subtracted data for all voxels in a cluster eliminating a great
deal of excel editing.
NOTE--you can also create your own cluster by painting it--can
select width of brush& 3d as well-- Tools--fmri--graph current
selection, tools--fmri--print timecourse summary to file, and
should save the label too)!
- Explanation:
All
runs for an individual subject are now averaged together in this
view of the data. Green square mark the location of each cluster.
-
-analysis
video1 indicates which analysis
directory to use
-
-contrast
allvcon indicates which contrast file to use in the analysis
directory "video2"
-
-space
tal this dir contains the results of the post-talairaching
statsgrinder run, specifically "maps" like minsig
of the talairached data. The maps are then used in this step.
-
-map
minsig
-
-s
./e26154
-
-d
/buddy/data/tutorial this identifies the parent subject
directory
MRI Volume
Clustering
- Purpose:
This
command identifies clusters of activations that meet specified
criteria. It
then creates images, summary files and even numbered labels for
the output clusters.
- Usage:
mri_volcluster
--in
input volid
--in_type file format
--frame frameno <0>
--reg register.dat
--thmin minthresh
--thmax maxthresh (default is infinity)
--sign <abs>, neg, pos
--minsize minimum volume (mm^3)
--minsizevox minimum volume (voxels)
--mindist distance threshold <0>
--allowdiag : define contiguity to include diagonal
--mask mask volid (same dim as input)
--mask_type file format
--maskframe frameno <0>
--maskthresh upper threshold
--masksign <abs>, neg, pos
--maskinvert
--outmask final binary mask
--outmask_type file format
--sum file : text summary file
--out
outupt volid
--out_type file format
--ocn output cluster number volid
--ocn_type file format
--label label file
--nlabelcluster n : save nth cluster in label
--labelbase base : save all clusters under base-NNNN.label
--synth
synthfunc (uniform,loguniform,gaussian)
--help : how to use this program
- Command
Example:
> mri_volcluster
--in /buddy/data/tutorial/e25996/bold/video2/tal/allvcon/minsig
--in_type bfloat --reg /buddy/data/tutorial/e25996/bold/video2/tal/register.dat
--thmin 9 --sign pos --minsize 640 --allowdiag --out /buddy/data/tutorial/e25996/bold/video2/tal/allvcon/mpclus_minsig
--out_type bfloat --ocn /buddy/data/tutorial/e25996/bold/video2/tal/allvcon/mpclusnum_minsig
--ocn_type bfloat --labelbase /buddy/data/tutorial/e25996/bold/video2/tal/allvcon/me25996
--sum /buddy/data/tutorial/e25996/bold/video2/tal/allvcon/me25996sum
- Explanation:
- By
this point we have rejected the analysis in video1 as having
too much smoothing. So we only analyze video2.
- --in
/buddy/data/tutorial/e25996/bold/video2/tal/allvcon/minsig
specifies that minsig, one of several statistical
maps available for clustering, should be used.
- --in_type
bfloat specifies
that the type of map file being used is the bfloat (the
maps are created by stxgrinder)
- --reg
/buddy/data/tutorial/e25996/bold/video2/tal/register.dat
identifies
the registration.dat file that should be used for the procedure.
- --thmin
9
sets the p-value to .000000001 for clustering. The value should
represent the absolute log10 of the p-value.
Thus:
-thmin 1.3010 =.05,
-thmin 2 =.01,
-thmin 3=.001,
-thmin 4 =.0001
- --sign
pos tells the program to represent only those clusters
that are positively correlated to the experimental paradigm
and not those that are negatively correlated.
- --minsize
640 sets up a cluster of 10 voxels. [Although we often use
the equivalent of 3 voxels in our clustering, (voxels were resampled
to 4x4x4 [64 mm cubed], so 3x64=192 mm cubed), it is probably
better to use 640 (10 voxels) for this tutorial data, because
192 mm-cubed produces an awful lot of clusters.]
- --allowdiag
allows contiguity between voxels to be defined as including
voxels that touch on corners only.
- --out
will put a map of activations that meet the criteria into the
specified file, /buddy/data/tutorial/e25996/bold/video2/tal/allvcon/mpclus_minsig
(name it whatever you want...will get one per slice [e.g., 25)...so
why is this necessary if we have ocn?).
- --out_type
bfloat tells the program that the output images should be
bfloats.
- --ocn
will number each cluster output cluster number map in .bfloat
format (one for each slice, e.g., 25, but labelled)
- --ocn_type
will be bfloat.
- --labelbase
followed by prefix to add to each ocn label for the clusters
(one file for each cluster; later these label files can be loaded
to view each green square that demarcates an ROI)
- --sum
is the single summary file me25996sum which will hold
summary info on each cluster by its ocn number.
- Run
mri_volcluster once for each subject
Cluster
by Cluster Labeling
- Purpose:
This command computes the average HDR for a given cluster. These
averages are useful, because before running this for a cluster,
you see a different HDR in the timecourse graph for each different
voxel. The file h.txt contains the
average for an ROI defined by your cluster. Run this once for
each labeled cluster that you want to see information about.
can look at output from above (where?)--posclusnum
in tkmedit--in association with the summary file above (me25996sum)
to locate ROIs. ....Maybe w good cluster labeling, this
could be run as a session (say supFrntGyrus on every subject who
had the same label??
- Usage:
func2roi-sess
Options:
-roidef name : name of ROI definition
-analysis name : source is averaged data from analysis
-raw : source is raw data
-rawfsd : functional subdirectory for raw data (bold)
-motioncor : use motion corrected raw data (with -raw)
-rawstem : stem of raw data (f or fmc)
-rawrlf : run list file for raw data
-noraw : don't process raw data
-sesslabel name : use name.label found in sessid/labels
-anatlabel name : use name.label found in SUBJECTS_DIR/subject/label
-labelfile file : give full path of label file
-labelspace space
-labelspacexfm xfm file found in mri/transforms (talairach.xfm)
-maskcontrast contrast: contrast to use for mask
-maskthresh threshold
-masktail tail : thresholding tail (<abs>, pos, neg)
-maskmap map : map to use for mask <sig>
-maskframe frame : 0-based frame number in map <0>
-masksessid sessid : sessid of mask (default is that of source)
-maskanalysis name : analysis of mask (default is -analysis)
-maskspace space : space of mask (<native> or tal)
-maskisxavg effect: fixed or random (when masksessid is a group)
-float2int method: method = <tkreg>,round,floor
-sf sessidfile ...
-df srchdirfile ...
-s sessid ...
-d srchdir ...
-umask umask : set unix file permission mask
-scriptonly : don't run, just generate a script
-version : print version and exit
- Command
Example:
>func2roi-sess
-analysis video2 -roidef minsig_posclust -noraw -labelfile
/buddy/data/tutorial/practiceSubject/posclust-0001.label -s e26154
-d .
- Explanation:
the output of this command is saved to bold/video2/minsig_posclust/h-offset
as bvolume...once for each subject label of interest...maybe 1/2
a dozen??
Talairaching
- Purpose:
To talairach anatomical data.
- Command
Example:
>cp e26154_anat/mri/orig/* e26154_anat/mri/T1/
>talairach
e26154_anat
- Explanation:
You'll need to copy *.COR files from the orig directory to the
T1 directory in
order to talairach them.
The talairach command outputs talairach.xfm in the /mri/transforms
subdirectory. (e.g., /buddy/data/tutorial/e26154_anat/mri/transforms/talairach.xfm).
Talairaching
Functionals
- Purpose:
To
talairach functional data (uses register.dat file and /mri/transforms/talairach.xfm
files)
- Usage:
func2tal-sess
Required
Arguments:
-res mm : talairach resolution in mm (1,2,4,8)
-analysis analysisname : name of session-level functional analysis
Optional
Arguments:
-spacedir dir : default is tal
-xfm xfmfile : xfm file relative to subjid/mri/transforms
-umask umask : set unix file permission mask
-version : print version and exit
Session
Arguments (Required):
-sf sessidfile
-df srchdirfile
-s sessid
-d srchdir
- Command
Example:
>func2tal-sess -res 4 -analysis video2 -sf sessidfile -d .
- Explanation:
-res
4 talairach resolution set to 4 mm. -analysis video2
name of analysis directory. -sf uses the sessionidfile to identify
which subjects to run the process on. However, one could use -s
and specify an individual subject instead.
Stats
Grinder
Purpose
and Usage
Run
stxgrinder on talairached selxavg output
>stxgrinder-sess -analysis video2 -contrast allvcon -space
tal -s ./e26154 -d .
Check
your Work with tkmedit-sess
Purpose:
Bring up talaraiched functional data on talaraich (MNI) brain:
Command Example:
>tkmedit-sess -analysis video2 -contrast allvcon -space tal
-map minsig -s ./e26154 -d .
Explanation:
-space tal this dir contains the results of the post-talairaching
statsgrinder run, specifically "maps" like minsig of the
talairached data. The maps are then used in this step.
Fixed-effect
group analysis
- Purpose:
The
fixed-effect group analysis is a "quick" test that treats
a group of subjects as one subject. The criteria are thus not
as stringent as for the random effects group analysis (which treats
each subject separately).
- Usage:
isxavg-fe-sess
Options:
-analysis analysisname : session-level functional analysis name
-group groupname : name of group
-space spacename : space in which to average (native, tal, sph)
-hemi hemisphere : with sph space <lh rh>
-trunc sign : truncation (pos or neg; neg = set neg vals to 0)
-sf sessidfile ...
-df srchdirfile ...
-s sessid ...
-d srchdir ...
-umask umask : set unix file permission mask
-scriptonly : don't run, just generate a script
-version : print version and exit
- Command
Example
1:
>isxavg-fe-sess -analysis video2 -group fixedgroup -space
tal -trunc neg -sf sessidfile -d .
- Explanation:
-analysis video2 identifies the analysis directory to use
(does it get files from here or put files
in here? -group fixedgroup names a directory to
be created at the top level to contain the fixed-effect group
analyses -space tal
-trunc neg this option ignores/truncates all negative correlations,
i.e., it shows the positive correlations only in the output.
-sf sessidfile identifies the sessionidfile that the command
uses to find all the subjects.
-d /buddy/data/tutorial identifies the parent subject directory
to work in. Why no -contrast allvcon here
(as compared to the random effects analysis)?
>stxgrinder-sess -analysis video2 -s fixedgroup -space tal
-contrast allvcon -sf sessidfile -d .
- Explanation:
- Command:
Vol clustering with fixed-effect group analysis output
- >mri_volcluster
--in /buddy/data/tutorial/fixedgroup/bold/video25/tal-ffx/allvcon/minsig
--in_type bfloat --reg /buddy/data/tutorial/fixedgroup/bold/video2/tal-ffx/register.dat
--thmin 4 --sign pos --minsize 640 --allowdiag --out /buddy/data/tutorial/fixedgroup/bold/video2/tal-ffx/allvcon/4pclus_minsig
--out_type bfloat --labelbase
/buddy/data/tutorial/fixedgroup/bold/video2/tal-ffx/allvcon/fixed
--sum
/buddy/data/tutorial/fixedgroup/bold/video2/tal-ffx/allvcon/4fixedsum
- Displaying
the Positive Cluster Map from fixed group analysis
>tkmedit-sess
-contrast allvcon -analysis video2 -map 4pclus_minsig -space tal
-isxavg fixed -s fixedgroup -d .
- Func2ROI
with Fixed Group Analysis
1) copy all the h and h offset files from /buddy/data/tutorial/fixedgroup/bold/video2/tal-ffx
to /buddy/data/tutorial/fixedgroup/bold/video2/.
2) You then need to create an analysis.info file and place it
in this directory also. The file should read something like this
(although of course adapt it to your case. Also note that if you're
running the same analysis for the fixed effect group as
for what?...I'm missing something here. you can just cp
analysis.info file from a subject directory...so
analysis.info does not exist until you create it here?):
- analysis
video2
TR 2.5
designtype event-related
nconditions 3
parname par.txt
fsd bold
funcstem fmc
tpexclude
- 3)
cp register.dat file that was in here:/buddy/data/tutorial/fixedgroup/bold/video2/tal-ffx
to fixedgroup/bold.
- 4)
Make a subjectname file in fixedgroup directory with "talairach"
in the body (no "s).
- 5)
Use func2roi-sess command:
- >func2roi-sess
-analysis video5 -labelspace tal -roidef ./tal-ffx/allvcon/roi_0002
-noraw -labelfile /buddy/data/tutorial/fixedgroup/bold/video2/tal-ffx/allvcon/fixed-0002.label
-s fixedgroup -d .
- Makes
fixedgroup/bold/video2/tal-ffx/allvcon/roi_0002 directory and
creates a set of mask files and the h.txt file...
- TO
VIEW:
Regular minsig map:
>tkmedit-sess -contrast allvcon -analysis video5 -map minsig
-space tal -isxavg fixed -s fixedgroup -d .
- TO
view label:
>tkmedit-sess -contrast allvcon -analysis video5 -map roi_0002/mask
-space tal -isxavg fixed -s fixedgroup -d .
Random
Effects Group Analysis
- Purpose:
- Usage:
isxavg-re-sess
Options:
-analysis analysisname : session-level functional analysis name
-group groupname : name of group
-space spacename : space in which to average (native, tal, sph)
-hemi hemisphere : with sph space <lh rh>
-contrast contrastname: contrast name
-pctsigch : use percent signal change
-nojackknife : do not use jackknifing
-trunc sign : truncation (pos or neg; neg = set neg vals to 0)
-sf sessidfile ...
-df srchdirfile ...
-s sessid ...
-d srchdir ...
-scriptonly : don't run, just generate a script
-version : print version and exit
- Command:
>isxavg-re-sess -analysis video2 -contrast allvcon -group
randomgroup -space tal -sf sessidfile -d .
- Explanation:
- -analysis
video2 identifies
the analysis directory to use
- -contrast
allvcon
identifies the contrast to be used .
- -group
randomgroup names
a directory to be created at the top level to contain the random-effects
group analyses
- -space
tal
- -trunc
neg ??
- -sf
sessidfile identifies
the sessionidfile that the command uses to find all the subjects.
- -d
. identifies
the parent subject directory to work in.
Compare
Results
- Purpose:
Compare the results of the random-group and fixed-group analyses.
- Commands:
>tkmedit-sess -analysis video2 -contrast allvcon -space
tal -map msig -isxavg random -s randomgroup -d .
>tkmedit-sess
-analysis video2 -contrast allvcon -space tal -map pclus_minsig
-isxavg fixed -s fixedgroup -d .
- Explanation:
View
Random Effects Clusters with Fixed Effects Analysis Headers
- Purpose:
- Commands:
>tkmedit-sess -analysis video2 -contrast allvcon -space
tal -map minsig -isxavg random -s /buddy/data/tutorial/randomgroup
-d .
- GUI:
File->Load Timecourse: /buddy/data/tutorial/fixedgroup/bold/video2/tal-ffx/allvcon
stem: minsig
Register: /buddy/data/tutorial/fixedgroup/bold/video2/tal-ffx/allvcon/register.dat
- Explanation:
|